The DIRSIG sli_tool is a command-line program to interact with ENVI
Spectral Library (SLI) files.
Overview
DIRSIG5 and the scene2hdf scene compiler support the use of spectral libraries as input to a variety of optical properties including:
Similar to the DIRSIG image_tool command-line program for interacting with image files, this tool features a suite of features to create, analyze and extract data from SLI files. The usage (help) output of the tool outlines these features:
$ sli_tool -h
Usage: sli_tool [options] <command> ...

Options:
  -h/--help
	Display this help and exit.
  --log_level string
	Sets the minimum logging level. Values are: debug, info, warning, error, critical, off

Commands:
  extract
  convert
  analyze

For subcommand help: sli_tool <command> -h
The Convert Tool
The convert tool is used to create SLI files from other data sources.
As a reminder, an SLI file can store any kind of spectral data so the input
files are assumed to be in the correct units already.
To see the options available for the "convert" tool, use the help syntax:
convert tool.$ sli_tool convert -h
Usage: sli_tool ... convert [options] filenames+
Positional Arguments:
filenames
The input filename(s) to convert (.txt, .xml, .ems, .sli)
Options:
-h/--help
Display this help and exit.
-o/--output string
The output filename. By default, 'output.sli'
-d/--description string
The description to put in the header file.
--reflectance_scale float
The reflectance scale factor to put in the header file. By default, 1.0
--spectral_samples string
Override the spectral samples.The tool currently supports reading the following as inputs:
-
ASCII/Text files,
-
DIRSIG emissivity files, and
-
Other SLI files
Multiple input file types can be converted into a single file at once.
Converting ASCII/Text Files
The tool can import two-column, whitespace delimited ASCII/Text files.
0.4 0.145
0.5 0.098
0.6 0.131
0.7 0.184
0.8 0.176
|
|
The first column is assumed to be the wavelength in microns. |
This file can be converted to a single spectrum SLI file with the following syntax:
$ sli_tool convert example.txt -o example.sliIf you have multiple ASCII/Text files, they can be converted and merged into a single SLI file by providing a list of input files:
$ sli_tool convert blue_paint.txt green_paint.txt red_paint.txt -o paints.sli|
|
The wavelengths used in the output library come from the first file. If the files have different wavelength samples, they will be interpolated, downsampled, etc. to the wavelengths defined by the first file. |
The names for the spectra are created from the filename(s). For example,
in the case above the names will be blue_paint.txt, green_paint.txt
and red_paint.txt, respectively.
Converting Emissivity Files
You can convert existing DIRSIG emissivity files to spectral library with the following syntax:
$ sli_tool convert grass.ems -o grass.sliIf the EMS file contains multiple curves, all of the curves will be added
the library. The spectra names will be created from the filename and curve
number. For the example above, the spectra names will be grass.ems[0],
grass.ems[1], etc.
Multiple EMS files can be combined into a single library by providing a list of input files:
$ sli_tool convert grass.ems dirt.ems -o grass_dirt.sliConverting Different Files
The tool can automatically convert multiple input file types (including other SLI files) into a single output library:
$ sli_tool convert red_paint.txt grass.ems dirt.sli -o scene.sliOverriding the Spectral Sampling
If you do not want the first file to define the spectral samples for the
library, you can provide an input file that defines the desired spectral
samples via the --spectral_samples option:
$ sli_tool convert red_paint.txt --spectral_samples my_samples.txt --output scene.sliThe format of the input spectral samples file matches that used by the scene2hdf tool.
The Analyze Tool
The analyze tool will perform basic statistical analysis on an existing
SLI file. The available options can be found using the help syntax:
analyze tool.$ sli_tool analyze -h
Usage: sli_tool ... analyze [options] operator filename
Positional Arguments:
operator (required!)
The analysis operator to perform (mean_stddev, covariance)
filename (required!)
The input filename (.sli, .img)
Options:
-h/--help
Display this help and exit.Computing the Spectral Mean and Standard Deviation
The mean_stddev output will compute the spectral mean and standard
deviation and output the values in an ASCII/Text two-column format:
$ sli_tool analyze mean_stddev grass_mixed.sli
0.0242846 0.0079270
0.0244576 0.0079602
0.0247903 0.0080341
[lines deleted for documentation purposes]
1.0471117 0.0471904
1.0473640 0.0474431
1.0476190 0.0476986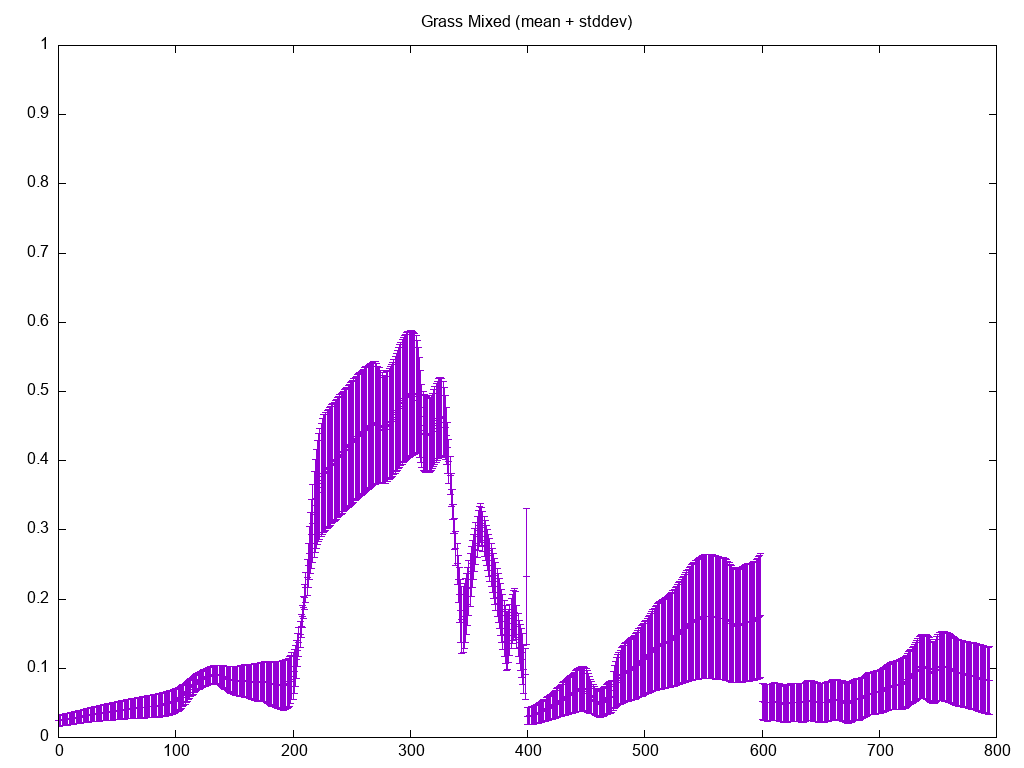
Computing the Spectral Covariance
The covariance output will compute the spectral covariance and
output the values as an N x N matrix of values, where N is the number of
wavelength samples. The output is ASCII/Text with N lines each containing
N whitespace delimited values.
$ sli_tool analyze covariance grass_mixed.sli
0.0000628 0.0000631 0.0000637 0.0000642 0.0000643 0.0000644 0.0000652 ...
[lines deleted for documentation purposes]
0.0000637 0.0000638 0.0000640 0.0000641 0.0000642 0.0000644 0.0000645 ...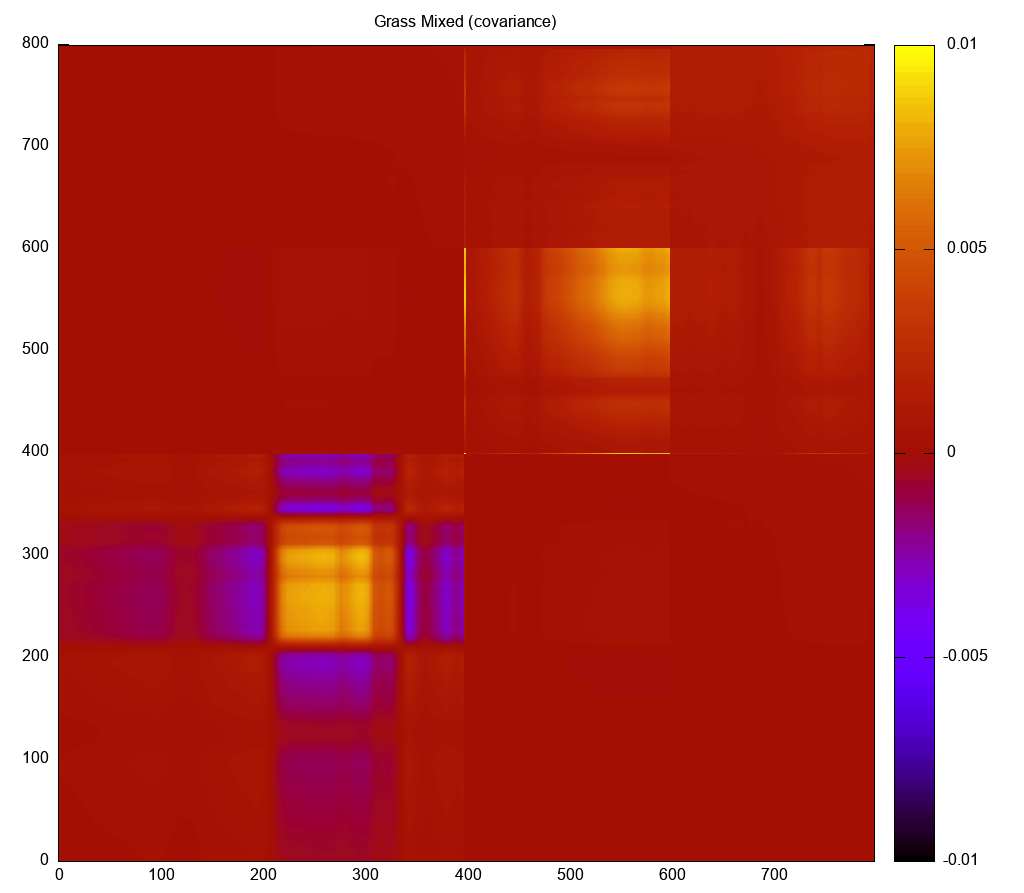
The Extract Tool
The extract tool allows the user to pull an individual spectrum
from an existing SLI file. The available options can be found using
the help syntax:
extract tool.$ sli_tool extract -h
Usage: sli_tool ... extract [options] filename
Positional Arguments:
filename (required!)
The input filename (.sli, .img)
Options:
-h/--help
Display this help and exit.
-s/--spectrum_name string
Extract a specific spectrum by its name.
-i/--spectrum_index int
Extract a specific spectrum by its index.Extracting a Spectrum Using the Index
You can extract a single spectrum using the 0-based index associated with it in the library file:
$ sli_tool extract --index 0 grass_mixed.sli
0.4000000 0.0079470
0.4008460 0.0080530
0.4016960 0.0081670
[lines deleted for documentation purposes]
14.1335000 1.0000000
14.2092000 1.0000000
14.2857000 1.0000000
The output is a two-column ASCII/Text stream with each line containing wavelength and value pairs.
Extracting a Spectrum Using the Name
You can also extract a single spectrum using the name associated with it in the library file:
$ sli_tool extract --spectrum_name "grass_mixed.ems[0]" grass_mixed.sli
0.4000000 0.0079470
0.4008460 0.0080530
0.4016960 0.0081670
[lines deleted for documentation purposes]
14.1335000 1.0000000
14.2092000 1.0000000
14.2857000 1.0000000|
|
Wrapping the name with quotes is advised since many shells
might interprete the [] as part of a regular expression.
|